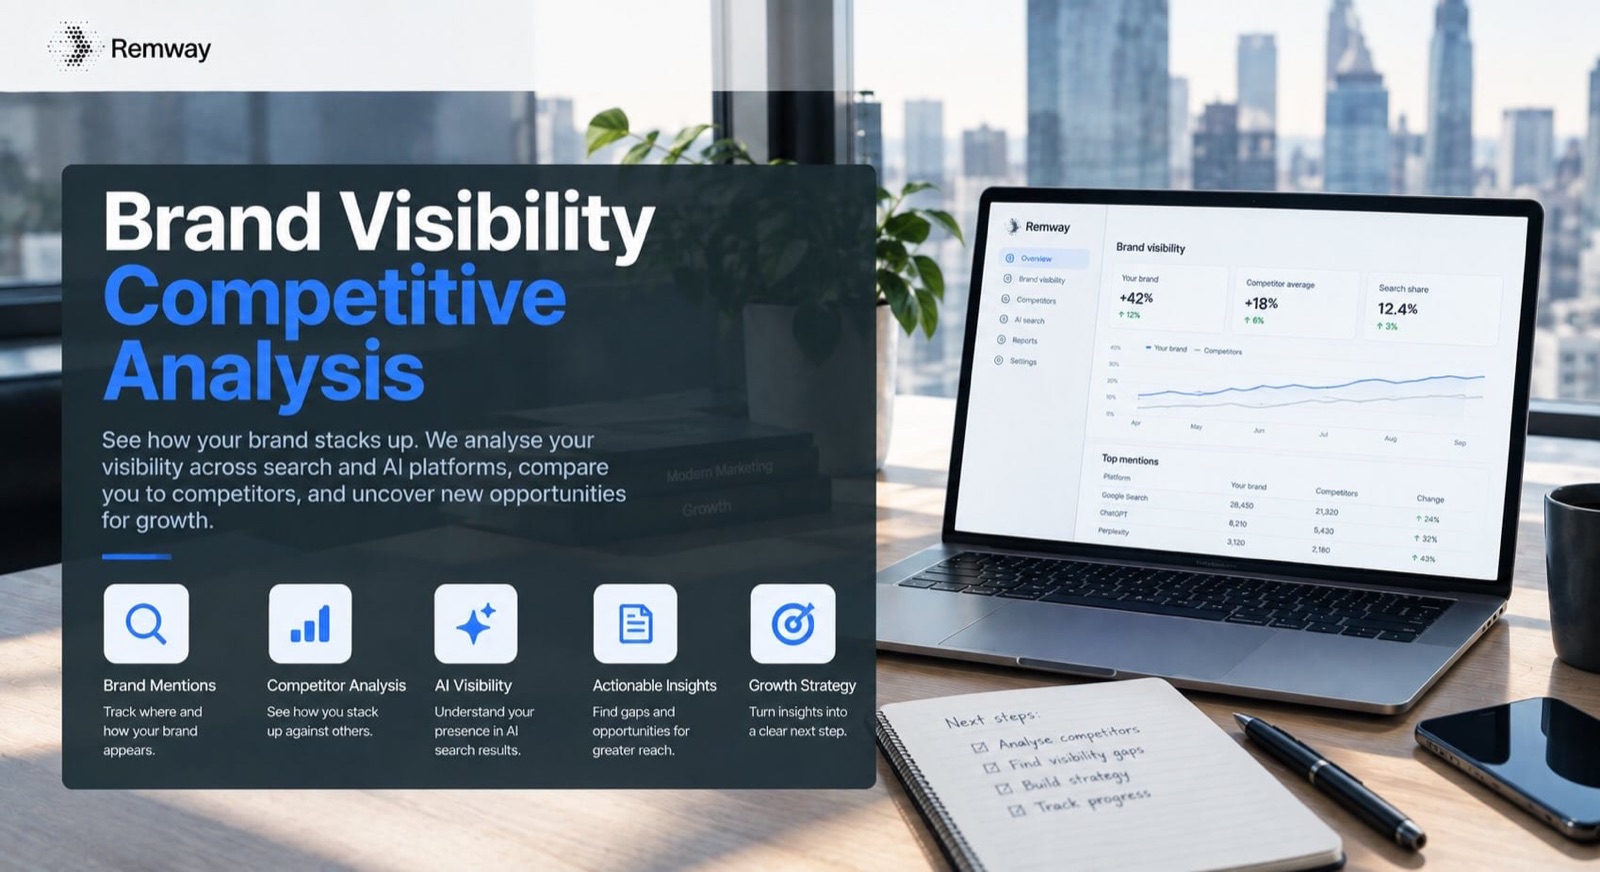
Brand visibility competitive analysis in AI search is the process of mapping which brands an AI engine recommends — and in what order — when a buyer asks a question about your category. Most marketing teams stop at “are we mentioned at all?” That question is almost meaningless on its own. The useful question is: when a potential customer asks ChatGPT or Perplexity to recommend a tool like yours, who appears first, who appears consistently, and where do you sit relative to named competitors? This guide gives you a repeatable method you can run this week.
Why Brand Visibility Competitive Analysis Starts With a Baseline, Not Your Own Name
Checking whether your brand appears in AI answers, without comparing it to competitors, tells you almost nothing actionable. You might appear in 40% of queries. That sounds reasonable until you discover your closest competitor appears in 90%. Alternatively, you might appear in only 20% of queries, but so does everyone else in a genuinely fragmented category. Without a competitive baseline, you cannot tell the difference.
AI engines like ChatGPT, Perplexity, and Google Gemini construct answers by drawing on patterns across billions of documents. They do not rank brands the way a search engine ranks pages. Instead, they build a mental model of which brands are credibly associated with which problems. That model is shaped by content volume, source authority, citation patterns, and co-mention frequency.
Furthermore, AI answers are positional. A brand named first in a recommendation list behaves differently from one named fifth. Buyers read AI answers the way they read any list — the first name registers, the last one is often forgotten. Therefore, understanding your AI search visibility relative to competitors is the only way to know whether you have a positioning problem or a content problem.
Choosing Your Competitor Set for Brand Visibility Competitive Analysis
A useful competitor set for brand visibility competitive analysis includes three distinct groups: direct competitors, category incumbents, and wildcard names that AI models surface unprompted. Most teams only track the first group. That is a mistake.
Direct competitors are the brands your sales team already knows about. Category incumbents are the older, larger brands that dominate training data simply because they have been written about for longer. Wildcards are the brands that keep appearing in AI answers even though you would not have listed them as competitors — often newer tools that have produced a disproportionate volume of credentialed, citation-rich content.
To find your wildcards, run ten open-ended category queries across two or three AI engines before you build your tracking list. Record every brand name that appears. Any brand appearing in more than three answers should go on your competitor list, whether you recognise it or not. This step alone often surfaces one or two names that should concern a marketing lead far more than the usual suspects.
- Start with five to eight direct competitors your sales team encounters regularly
- Add two or three category incumbents, even if they serve a slightly different segment
- Include every wildcard brand surfaced in your initial exploratory queries
- Keep the total competitor set to ten brands or fewer for manageability
- Revisit the set every quarter, because AI model training shifts over time
Building the Query Set: The Core of Brand Visibility Competitive Analysis
Brand visibility competitive analysis depends entirely on asking the right queries. A query set that only contains your brand name will miss most of the relevant AI conversations. Buyers rarely ask about your brand directly. They ask about their problem, their category, and their alternatives.
Build a query set of 15 to 20 queries across four types. First, category queries: broad questions a buyer might ask early in their search, such as “what is the best project management tool for remote teams?” Second, alternative queries: questions that signal switching intent, such as “what are the best alternatives to [competitor name]?” Third, use-case queries: specific problem statements, such as “which tool helps a SaaS team manage customer onboarding without custom dev work?” Fourth, comparison queries: direct head-to-head prompts, such as “compare [Competitor A] and [Competitor B] for a mid-market SaaS team.”
For example, if you sell B2B customer success software, your query set might include: “best customer success platforms for SaaS,” “alternatives to Gainsight for smaller teams,” “how to reduce churn without a large CS team,” and “Gainsight vs ChurnZero for a 50-person company.” Each query type reveals a different slice of how AI models position brands in your space. You can also review tools compared in guides like this profound alternative roundup to understand how AI engines frame competitive comparisons in practice.
Running Queries Across AI Engines and Noting the Differences
Brand visibility in AI search is not consistent across engines. ChatGPT, Perplexity, Google Gemini, and Claude each draw on different data sources, weight citations differently, and surface brands with different frequency patterns. Running your query set across at least three engines is therefore essential for a complete picture.
Perplexity tends to cite sources explicitly, making it easier to understand why a brand appears. ChatGPT answers are more likely to reflect patterns baked into training data, with less transparent sourcing. Google Gemini blends web retrieval with its own training, and it tends to surface brands with strong organic search presence. Additionally, answers vary by session and by how a query is phrased — so run each query at least twice per engine and record both responses.
Keep a structured log. For each query, record: the engine used, the date, every brand mentioned, the order of mention, and whether your brand or a competitor was named as the primary recommendation. Consistency across runs matters more than any single answer. For more on how Gemini specifically handles brand signals, see this guide on Google Gemini AI visibility.
Scoring Your Results: Share of Voice, Position, and Co-Mention Patterns
Brand visibility competitive analysis produces four key metrics: share of voice, average mention position, default recommendation rate, and co-mention patterns.
Share of voice is the percentage of total queries in which a brand appears at least once. Average mention position is where in the answer that brand typically sits — first, second, or later. Default recommendation rate is how often a brand is named as the primary or best option, rather than simply listed. Co-mention patterns show which brands are habitually grouped together, which matters for positioning because AI engines tend to cluster brands that share a content and citation universe.
The table below shows a worked example across five fictional competitors in a B2B SaaS category. Data is illustrative and labelled as such.
| Brand (Example) | Share of Voice | Avg. Mention Position | Default Rec. Rate | Strongest Query Type |
|---|---|---|---|---|
| Competitor A | 88% | 1.2 | 62% | Category queries |
| Competitor B | 74% | 2.8 | 18% | Alternative queries |
| Your Brand | 52% | 3.4 | 9% | Use-case queries |
| Wildcard C | 41% | 2.1 | 14% | Comparison queries |
| Competitor D | 29% | 4.6 | 3% | Use-case queries |
In this example, “Your Brand” has reasonable share of voice but a poor average position and a low default recommendation rate. That pattern suggests AI models recognise the brand but do not treat it as the leading option. The strongest performance on use-case queries is a signal worth building on. For context on what metrics matter most across AI platforms, this piece on AI visibility metrics for Gemini covers the tracking approach in more detail.
Reading the Results and Acting on Each Pattern
Brand visibility competitive analysis produces patterns, and each pattern has a different response. The most common patterns are: absent from category queries but present in use-case queries; present but consistently mid-list; named frequently but never as the default recommendation; and strong on one engine, weak on others.
If you are absent from category queries, the problem is usually content authority. AI models have not seen enough credible, third-party-cited content connecting your brand to the category label buyers use. The fix is producing human-reviewed, citation-rich content that explicitly names the category and defines your position within it. For a practical starting point on AEO content structure, see AEO optimised article techniques.
If you appear consistently but mid-list, the problem is often co-mention quality. You are being grouped with second-tier brands. Producing content that compares you favourably to first-tier competitors — and earning citations from authoritative sources — gradually shifts that grouping. If you are never named as the default, focus on comparison and alternative queries first. These are the highest-intent query types, and improving visibility there has a faster effect on pipeline than improving general category mentions.
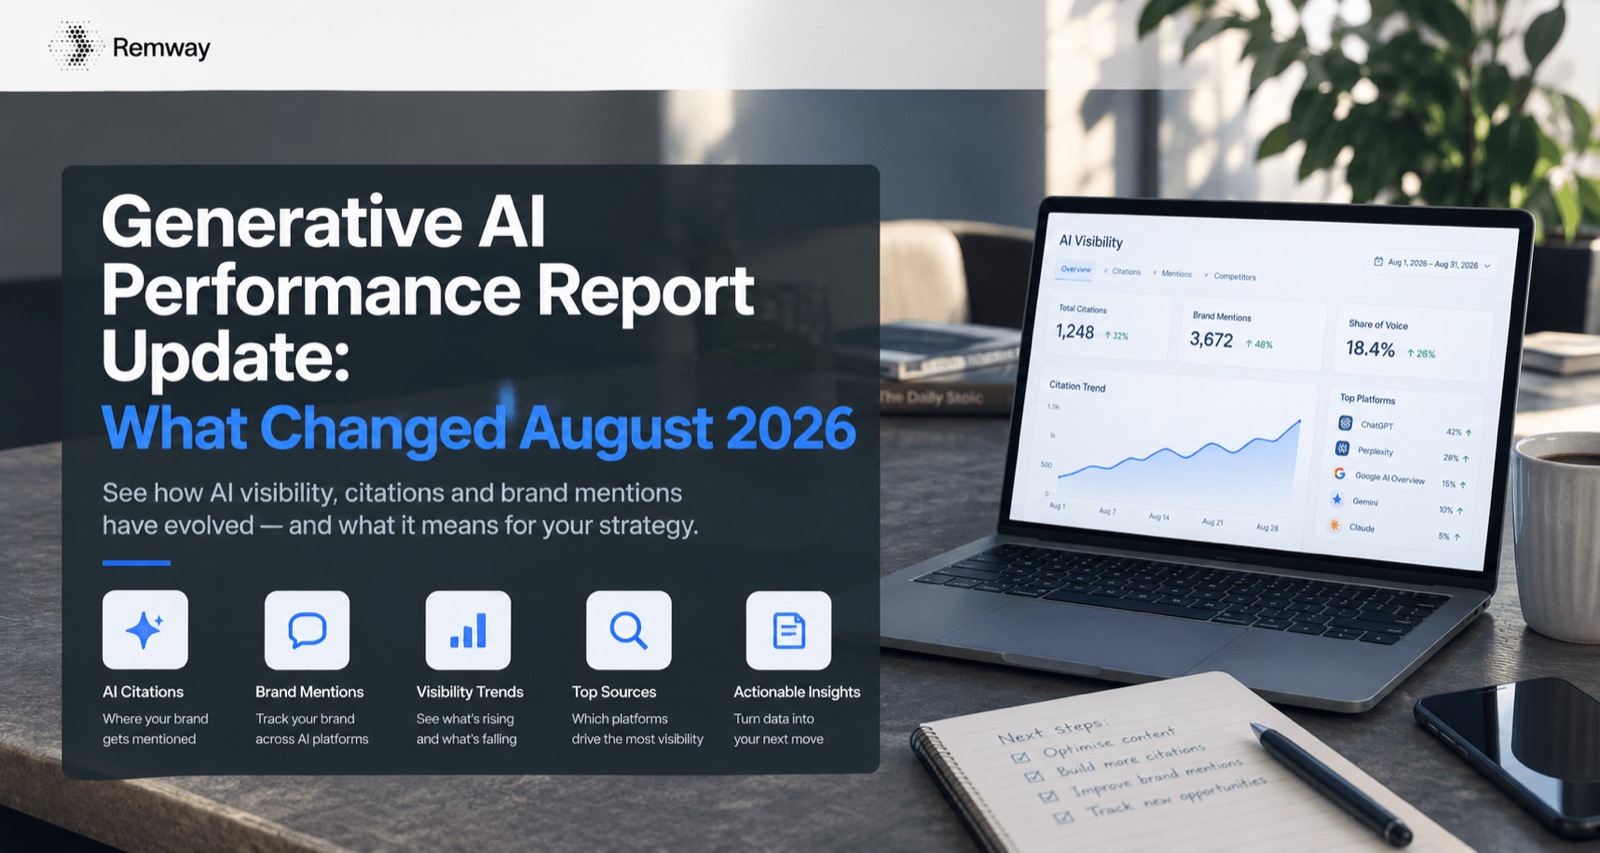
Finally, if results differ sharply between engines, investigate the source differences. Perplexity’s citation trail will often show you exactly which pages are driving a competitor’s strong performance on that engine. That tells you precisely what content to produce or earn links from. Tracking changes over time is also important — a generative AI performance report update can help you spot when model behaviour shifts and your scores change without any action on your part.
Frequently Asked Questions
How many competitors should I track in a brand visibility competitive analysis?
Track between six and ten competitors in total. Include your three to five closest direct competitors, one or two established category incumbents, and any wildcard brands that appear repeatedly in your initial exploratory queries. Tracking more than ten becomes difficult to manage consistently and dilutes your focus on the brands that actually affect your positioning.
How often should a competitive visibility analysis be repeated?
Run a full brand visibility competitive analysis quarterly. AI models update frequently, and a brand’s share of voice can shift noticeably after a model retraining or after a competitor publishes a significant volume of new credentialed content. Additionally, run a lighter monthly check — five to eight core queries — to catch sharp changes between full runs.
What is a good share of voice in AI answers?
There is no universal benchmark, because share of voice in AI answers depends heavily on category size and competitor count. As a working guide, appearing in more than 60% of relevant queries is strong for an established brand. More important than the absolute number is your position relative to direct competitors and whether your share of voice is trending upward over successive analysis runs.
Do different AI engines rank brands differently?
Yes, noticeably so. Perplexity weights real-time web citations heavily, which favours brands with strong recent content and inbound links. ChatGPT reflects its training data more than live retrieval, which tends to favour brands with longer-established content histories. Google Gemini blends both signals. Running your query set across at least three engines is therefore essential for a complete brand visibility competitive analysis picture.
How is brand visibility competitive analysis different from standard brand monitoring?
Standard brand monitoring tracks whether your brand is mentioned — in news, social media, or review sites. Brand visibility competitive analysis in AI search tracks where you sit relative to competitors when AI engines answer buyer questions directly. The difference matters because AI answers are positional and influential at the point of purchase, not just at the awareness stage. Monitoring tells you what is being said; competitive analysis tells you who is winning the recommendation.